
Around May 2022, I had extra money sitting in my bank account. My student loans were cleared, my other debts were gone, and my only remaining debt payment was a modest monthly car payment. I had been contributing just enough to my 401(k) to get the employer match — nothing more. With the wedding expenses and other commitments behind me, I was finally in a position to start building something.
So I started researching.
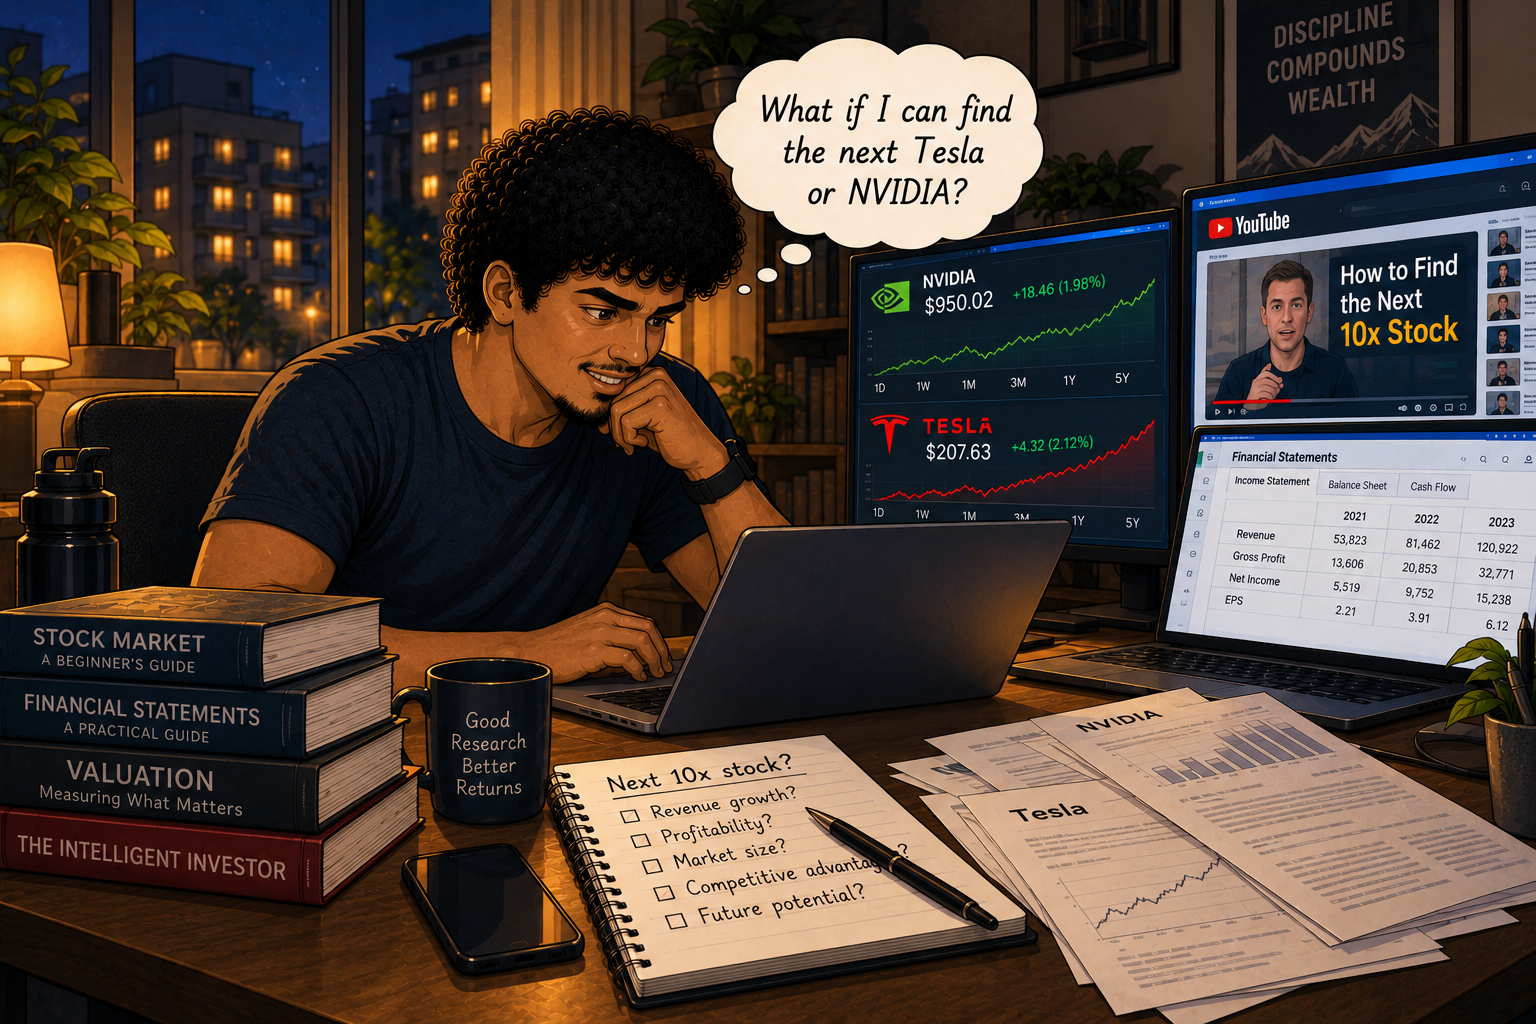
I went down every rabbit hole I could find — articles, YouTube videos, finance forums. I was convinced the right move was to find the next Tesla or NVIDIA, something that could double or triple my money quickly. I spent weeks learning to read company financials, understand growth metrics, evaluate future potential. In hindsight, I had no idea what I was actually doing. I just got swept up in the idea that the perfect pick was out there if I researched hard enough.
Along the way, I came across Vijay Mohan's YouTube channel and blog — Investment Insights. He made a simple, compelling case: invest in low-cost index funds like VTI, which tracks the entire US stock market, and VGT, which focuses specifically on the technology sector. He kept pointing to the S&P 500 — an index tracking around 500 leading large US companies — and how it had averaged roughly 10% annualized returns over the long term, including reinvested dividends. Allocate based on your risk appetite, and let time do the work.
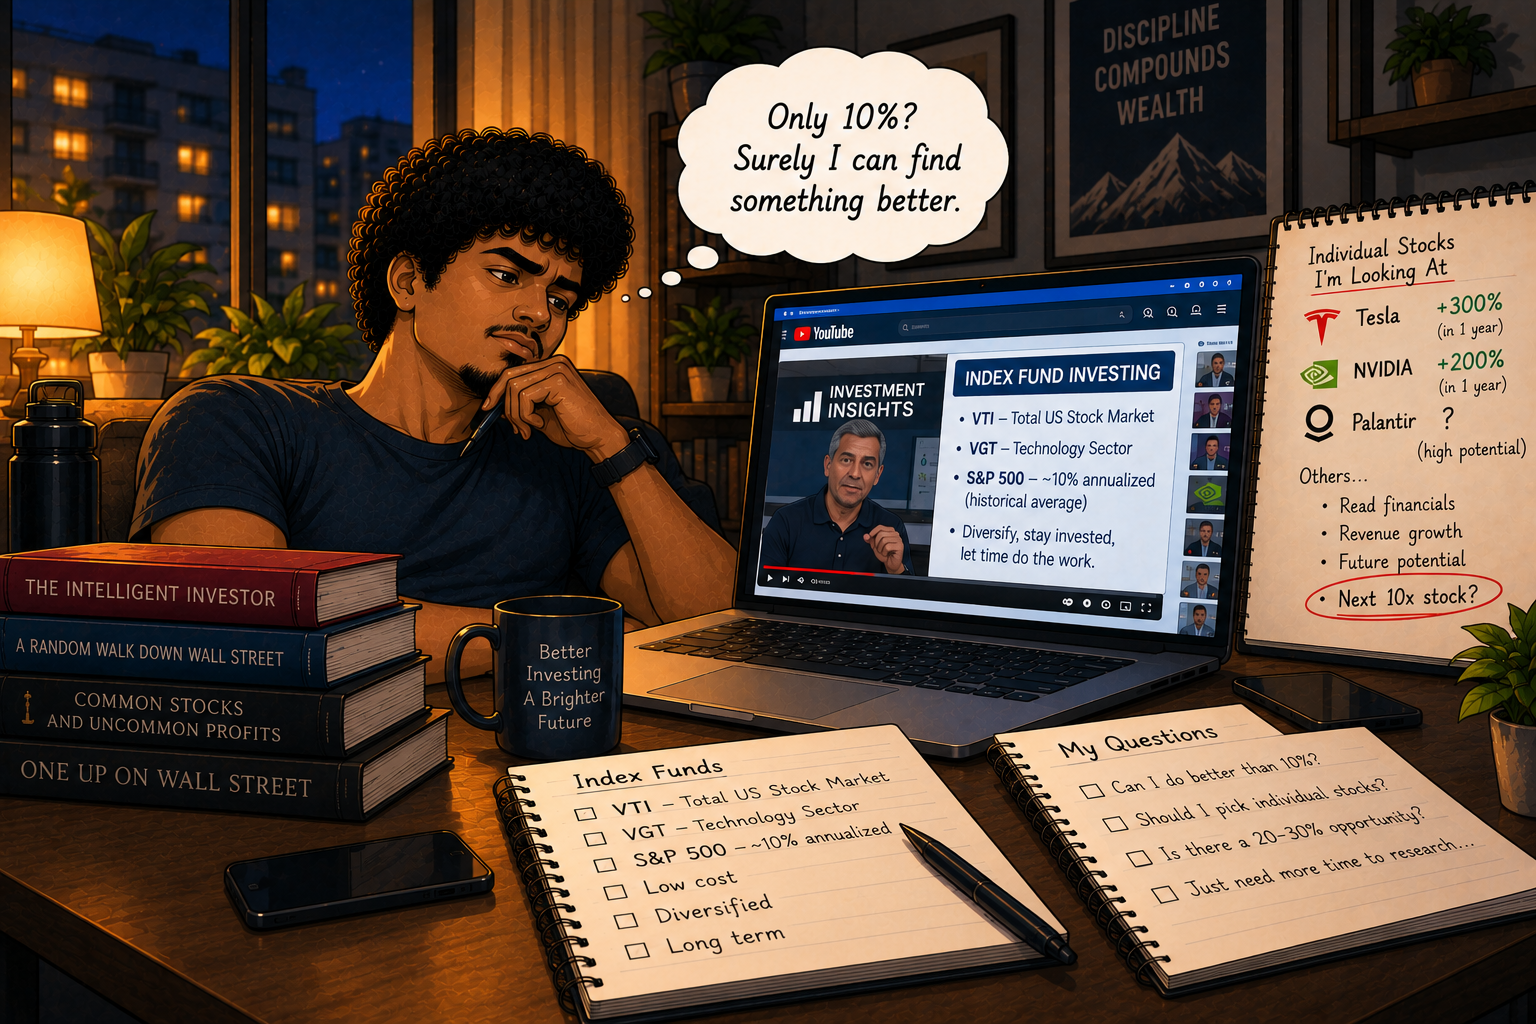
But 10% didn't excite me. I had been staring at charts of individual stocks — Tesla up 300%, NVIDIA up 200% in a single year — and 10% felt like settling. So I kept researching. Maybe there was something better. I just needed a little more time to find it.
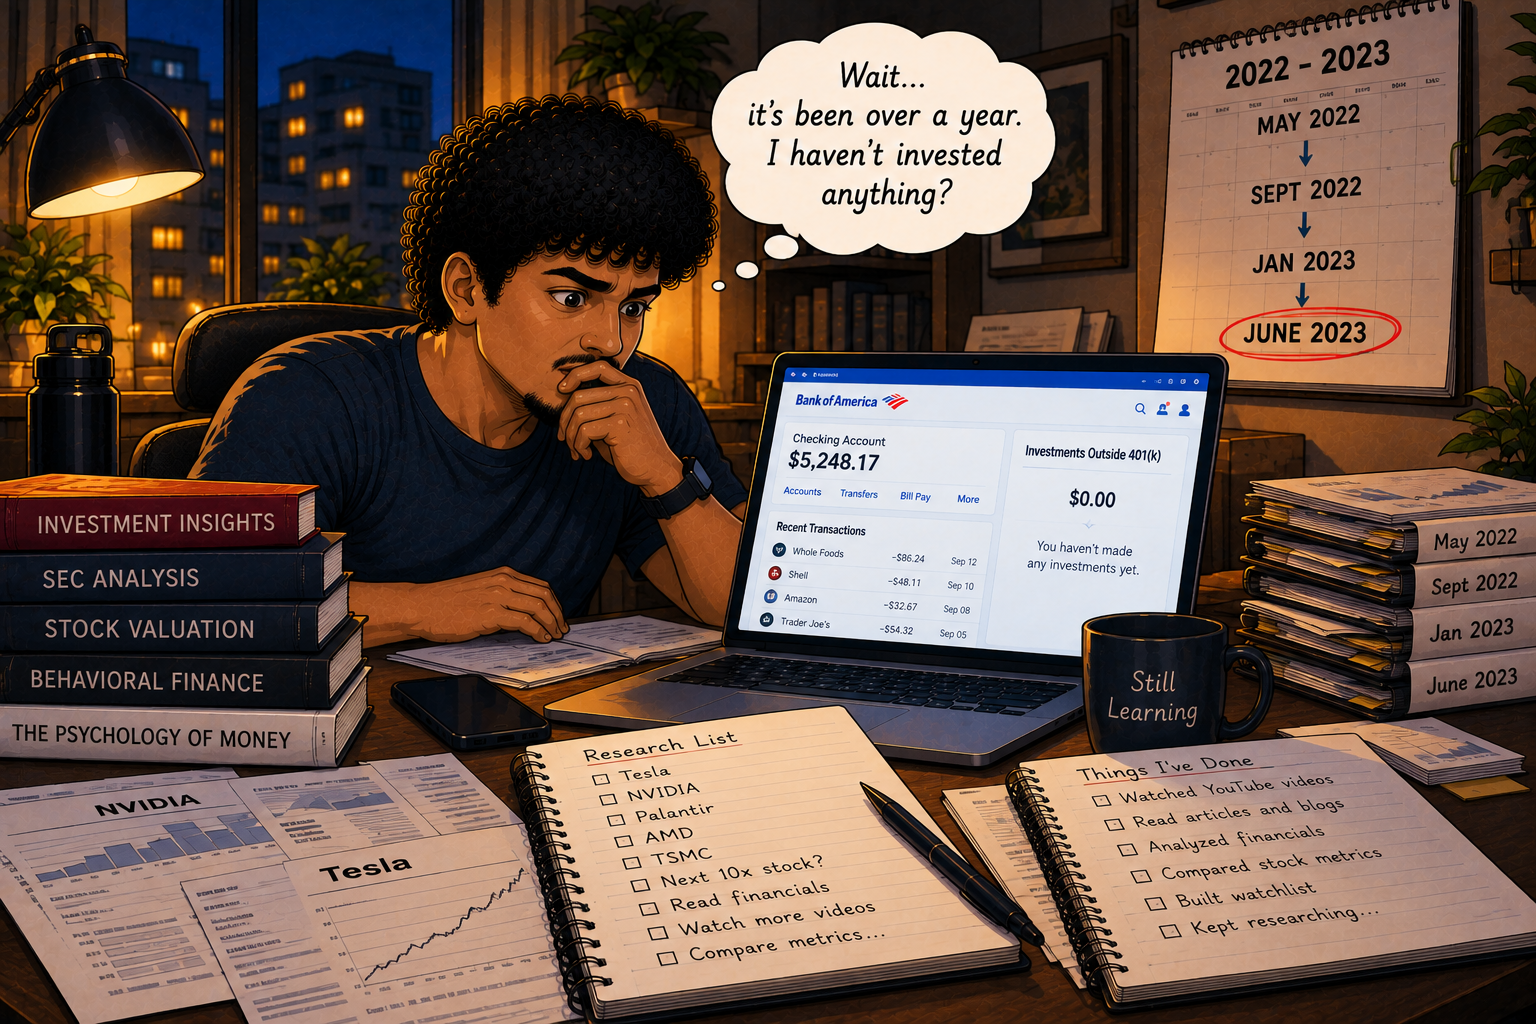
The problem was that while I kept researching, my money sat in a checking account doing nothing. From May 2022 through June 2023 — over a year — not a single dollar was invested outside my existing 401(k) contributions, even though I had no short-term need for that money. I kept telling myself the delay didn't matter. It's only 10%. I'm not losing anything. I'll invest next year — what's the difference?
Then I came across the concept of compounding, and I finally understood what the difference actually was.
When you invest early, your returns start generating their own returns. As your investment grows, future percentage gains apply to that larger amount. And when dividends are reinvested, they buy additional shares that can generate their own future returns.
Every year you delay doesn't just cost you one year of potential gains — it can cost you the future growth of those gains too. The earlier you start, the longer that chain has to compound.
To put my own situation in numbers: every $1,000 I could have invested in May 2022 would be worth an estimated $1,980 as of September 23, 2026, assuming dividends were reinvested — compared to an estimated $1,810 had I waited until June 2023. That's about $170 per $1,000 left on the table. I had significantly more than $1,000 sitting idle.
$170 on a $1,000 investment doesn't sound alarming. But that gap has the potential to grow significantly over time. If both amounts kept compounding at an assumed 10% annually — roughly the S&P 500's long-term historical average — that difference could grow to roughly $1,100 in 20 years, $3,000 in 30 years, and $7,700 in 40 years. Those aren't guaranteed returns, just an illustration of what the same gap can become. Multiply that by what I actually had sitting idle, and the numbers stop being easy to dismiss.
I got curious about what that same one-year delay would look like if it had happened decades earlier. So I ran the numbers using a few different starting years. Both columns show what $1,000 would have grown to by August 2026 — the S&P 500's total returns, dividends included.
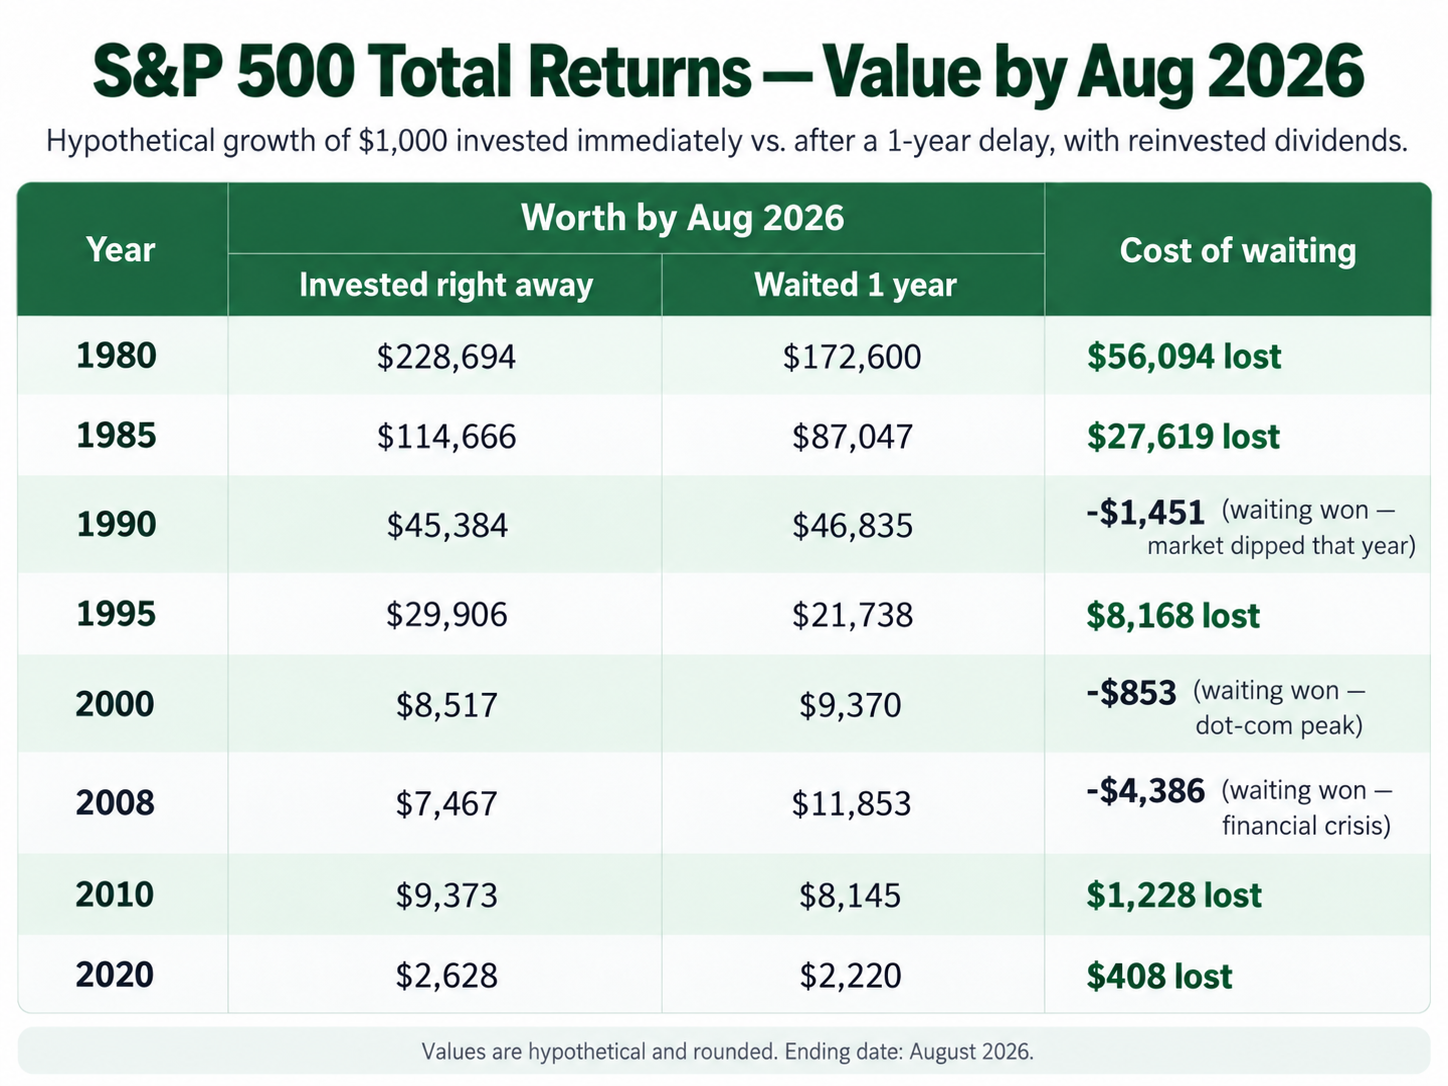
Investing earlier came out ahead in five of the eight examples. The three exceptions — 1990, 2000, and 2008 — were years when the market dropped, so waiting until the following January worked out better. But you can only see that looking back. At the start of any of those years, there was no way to know what the next twelve months would bring.
The 1980 row is worth pausing on: that single year's delay turned a $228,694 outcome into $172,600 — a gap of over $56,000 on a $1,000 investment. Of course, $1,000 in 1980 was worth a lot more than $1,000 today. I'm keeping the amount the same just to see how much difference a single year could make over decades.
I was also curious how the same pattern looked in the Indian market. Both columns show what ₹10,000 would have grown to by August 2026, using the NIFTY 50 Total Returns Index — dividends included.
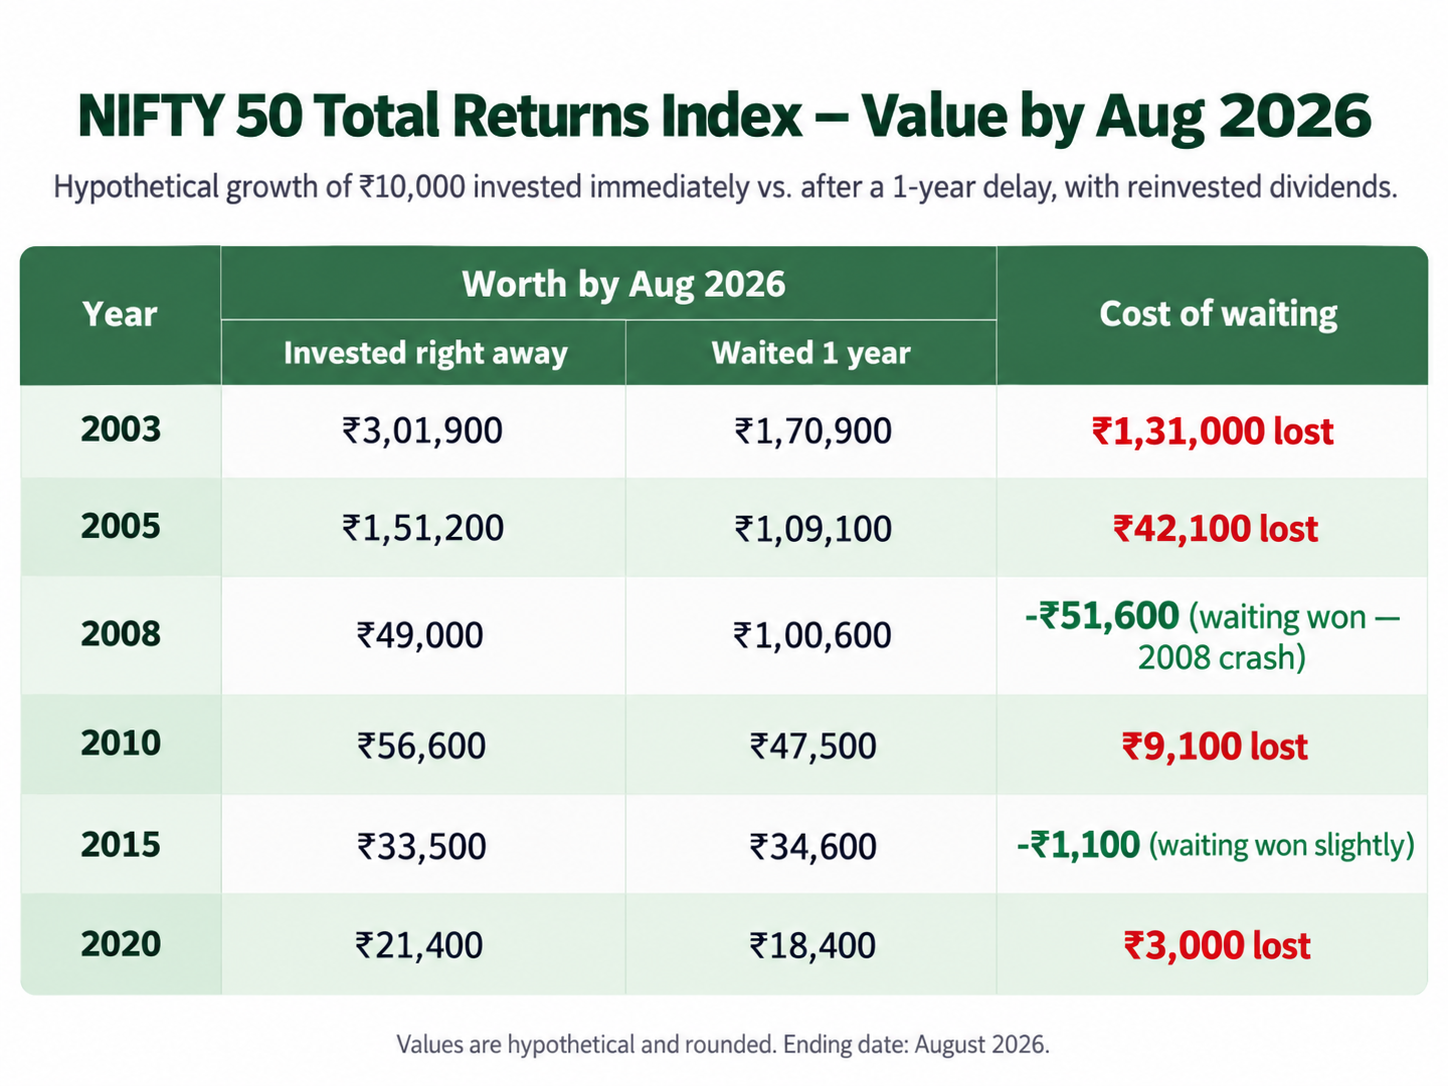
The 2003 case is striking — the NIFTY 50 Total Returns Index gained over 76% that year. Missing that single year meant approximately ₹1.31 lakh less in ending wealth on the same ₹10,000 investment by August 2026.
The 2008 exception matters too. Waiting until the following year would have worked out better because the market fell sharply during the financial crisis. But again — that's something you can only know in hindsight.
But what if I had actually found the next big thing? What if I had invested that money in Palantir instead of an index fund back in May 2022?
As of September 23, 2026, $1,000 invested in Palantir at the end of May 2022 would be worth roughly $22,100. The same $1,000 in my S&P 500 example would have grown to about $1,980.
And that's exactly the kind of return I was chasing.
But would I have actually picked Palantir back in May 2022?
I was already trying to evaluate dozens of companies at once. Did I have the knowledge or conviction to single out Palantir — a company still reporting losses, with its stock already well below its earlier highs — and put meaningful money into it?
Honestly, no. I had no clear thesis on any single stock. I was just reading summaries and hoping something would click.
Palantir already had a presence in AI and data analytics, but the scale of the generative AI opportunity that followed was far from obvious. Its AI Platform wasn't even launched until 2023.
Even after May 2022, the stock kept falling. By December that year it had lost another roughly 26% of its value. If I had invested $10,000, I would have been watching it sit at around $7,400 by year end. Would I have held through that? Honestly, I don't know. And even if I had, I would have needed the conviction to hold through months of further losses before it recovered — while continuing to believe I had picked the right one out of dozens I was already trying to evaluate.
Index funds offered a different approach. With something like VTI, I don't need to identify every extraordinary company before it becomes extraordinary. I get exposure to thousands of companies across the US market — some will struggle, some will fail, and others may grow far beyond anyone's expectations. That doesn't eliminate risk — index funds can and do fall hard in bad years. But it means my outcome isn't dependent on finding a handful of exceptional stocks and holding them through the uncertainty.
Seeing what my idle savings could have earned was sobering. The mistake wasn't that I took time to learn about index funds. It was that I already had an approach I believed in — and kept waiting anyway, thinking something better might come along. I already had enough information. I just kept moving the goalposts.
I didn't need one more article, one more video, or one more company to research.
I needed to stop waiting for the perfect investment.
Sources: S&P 500 Annual Total Returns · S&P 500 benchmark performance — State Street · NIFTY 50 TRI Whitepaper (NSE) · NSE Historical Index Data · HDFC MF Index Factsheet — August 2026
About the calculations: The personal S&P 500 comparison assumes investments made on May 31, 2022, or June 30, 2023, with both valued on September 23, 2026. Returns include estimated reinvested dividends using an assumed annual dividend yield of 1.4%. The historical S&P 500 table uses published calendar-year total returns through December 2025, extended using the index's 13.14% year-to-date total return through August 31, 2026. The NIFTY 50 table uses the NSE NIFTY 50 Total Returns Index, extended using its reported −7.0% year-to-date return through August 31, 2026. The Palantir comparison uses closing prices from May 31, 2022, and September 23, 2026, and excludes dividends, which the company does not pay. The 20-, 30-, and 40-year projections assume a hypothetical 10% annual return and are illustrative only. Historical index comparisons represent benchmark returns rather than returns from an actual index fund; investment expenses and tracking differences would affect realized returns. All figures assume the waiting cash earns no interest and exclude taxes and inflation. Values are hypothetical and rounded.